
Report Builder
The Report Builder in Jobtrain helps you create custom reports using live data from your Jobtrain recruitment system. Whether you're tracking job or candidate progress or preparing audit-ready reports, this tool is designed to put the right information in your hands.
Accessing the Report Builder
- Go to the Reports > My Reports tab in the top navigation bar.
- You’ll see:
- Personal Reports - personal reports that you’ve created
- Public Reports - shared reports created by your organisation or Jobtrain
- If you have permission to build reports, you’ll also see the Report Builder tab.
Create a new report
1. Go to the Report Builder.
2. Select your Data Source (e.g. Jobs, Applications, Interviews).
3. The system will load a preview report with default fields and filters based on your selection.
4. Drag fields into the report layout:
- Columns (X-axis) – for the main data points.
- Rows (Y-axis) – for charts.
- Filters – to narrow results (e.g. date, department).
5. Pick a Report Type:
- Table – up to 15 columns, 2000 rows.
- Charts (Pie, Bar, Trend) - designed to help you visualise patterns in your data (e.g. number of applications by department or trends over time).
Chart display limits help keep visuals easy to understand. If your data includes too many items, you can:
- Filter your data more narrowly
- View the top or bottom items
- Switch to a table layout
| Chart Type | Limit | Best for |
| Pie Chart | Max 6 slices | Simple breakdowns (e.g. source of application) |
| Bar Chart | Top/bottom 20 items | Comparisons (e.g. vacancies by department) |
| Trend Chart | Max 20 time intervals |
|
6. Click Run Report to preview the output.
7. Click Save, name your report and save it as:
- Personal (just for you), or
- Select Add to Public Report Library (if you have permission to share with others).
8. Export to Excel to view the full data available (up to 2000 rows)
View, edit or export an existing report
From My Reports
- Use search / filters to find reports by name, creator, or type.
- Each report has a card with options:
- View – runs the report.
- Edit – opens it in the builder (if you have permission).
- Export – downloads the table results to Excel.
- Remove – deletes it from your list.
Refining reports
Once your initial report layout is created, you can refine it to better focus on the information you need:
- Adjust Filters – Drag fields into the Filter area to narrow your (e.g. filter by department or status). This reduces the number of records shown and makes reports easier to analyse.
- Filters have options like:
- Is/Is Not/Contains/Does Not Contain for text.
- Greater Than/Less Than/Between for numeric fields.
- Date Ranges including quarters and fiscal years.
- Change Fields – Reorder or replace fields to alter how your data is displayed.
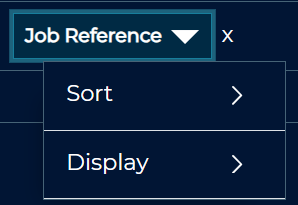
Some fields may display a down arrow to adjust the detail that is displayed:
- Sort Data - Apply sorting (ascending/descending) to organise your results.
- Display - For numeric fields, choose an aggregation type:
- Count Records
- Count Unique Records
Note: Fields that aren’t compatible with your selected chart type or existing fields configured will show a stop icon if you try to configure them and cannot be added.
Share or import a report
- Export your report settings as a Share File.
- A colleague can Import that file into their own Report Builder to recreate the report layout and filters.
Best practices for recruitment teams
- Start with predefined reports and tweak them to save time.
- Save common reports (like open vacancies by stage) to My Reports.
- Export reports to Excel for board papers or operational reviews.
FAQs
Can I build a report across multiple data sources?
No, reports can only use one data source at a time.
Can I share my reports with colleagues?
You can save reports as public reports if you have the correct permissions, or export a Share File for your colleague to import.
Are the reports real-time?
Yes, all reports use real-time data, but they are limited to 2000 rows for performance.